Solution overview
Key capabilities
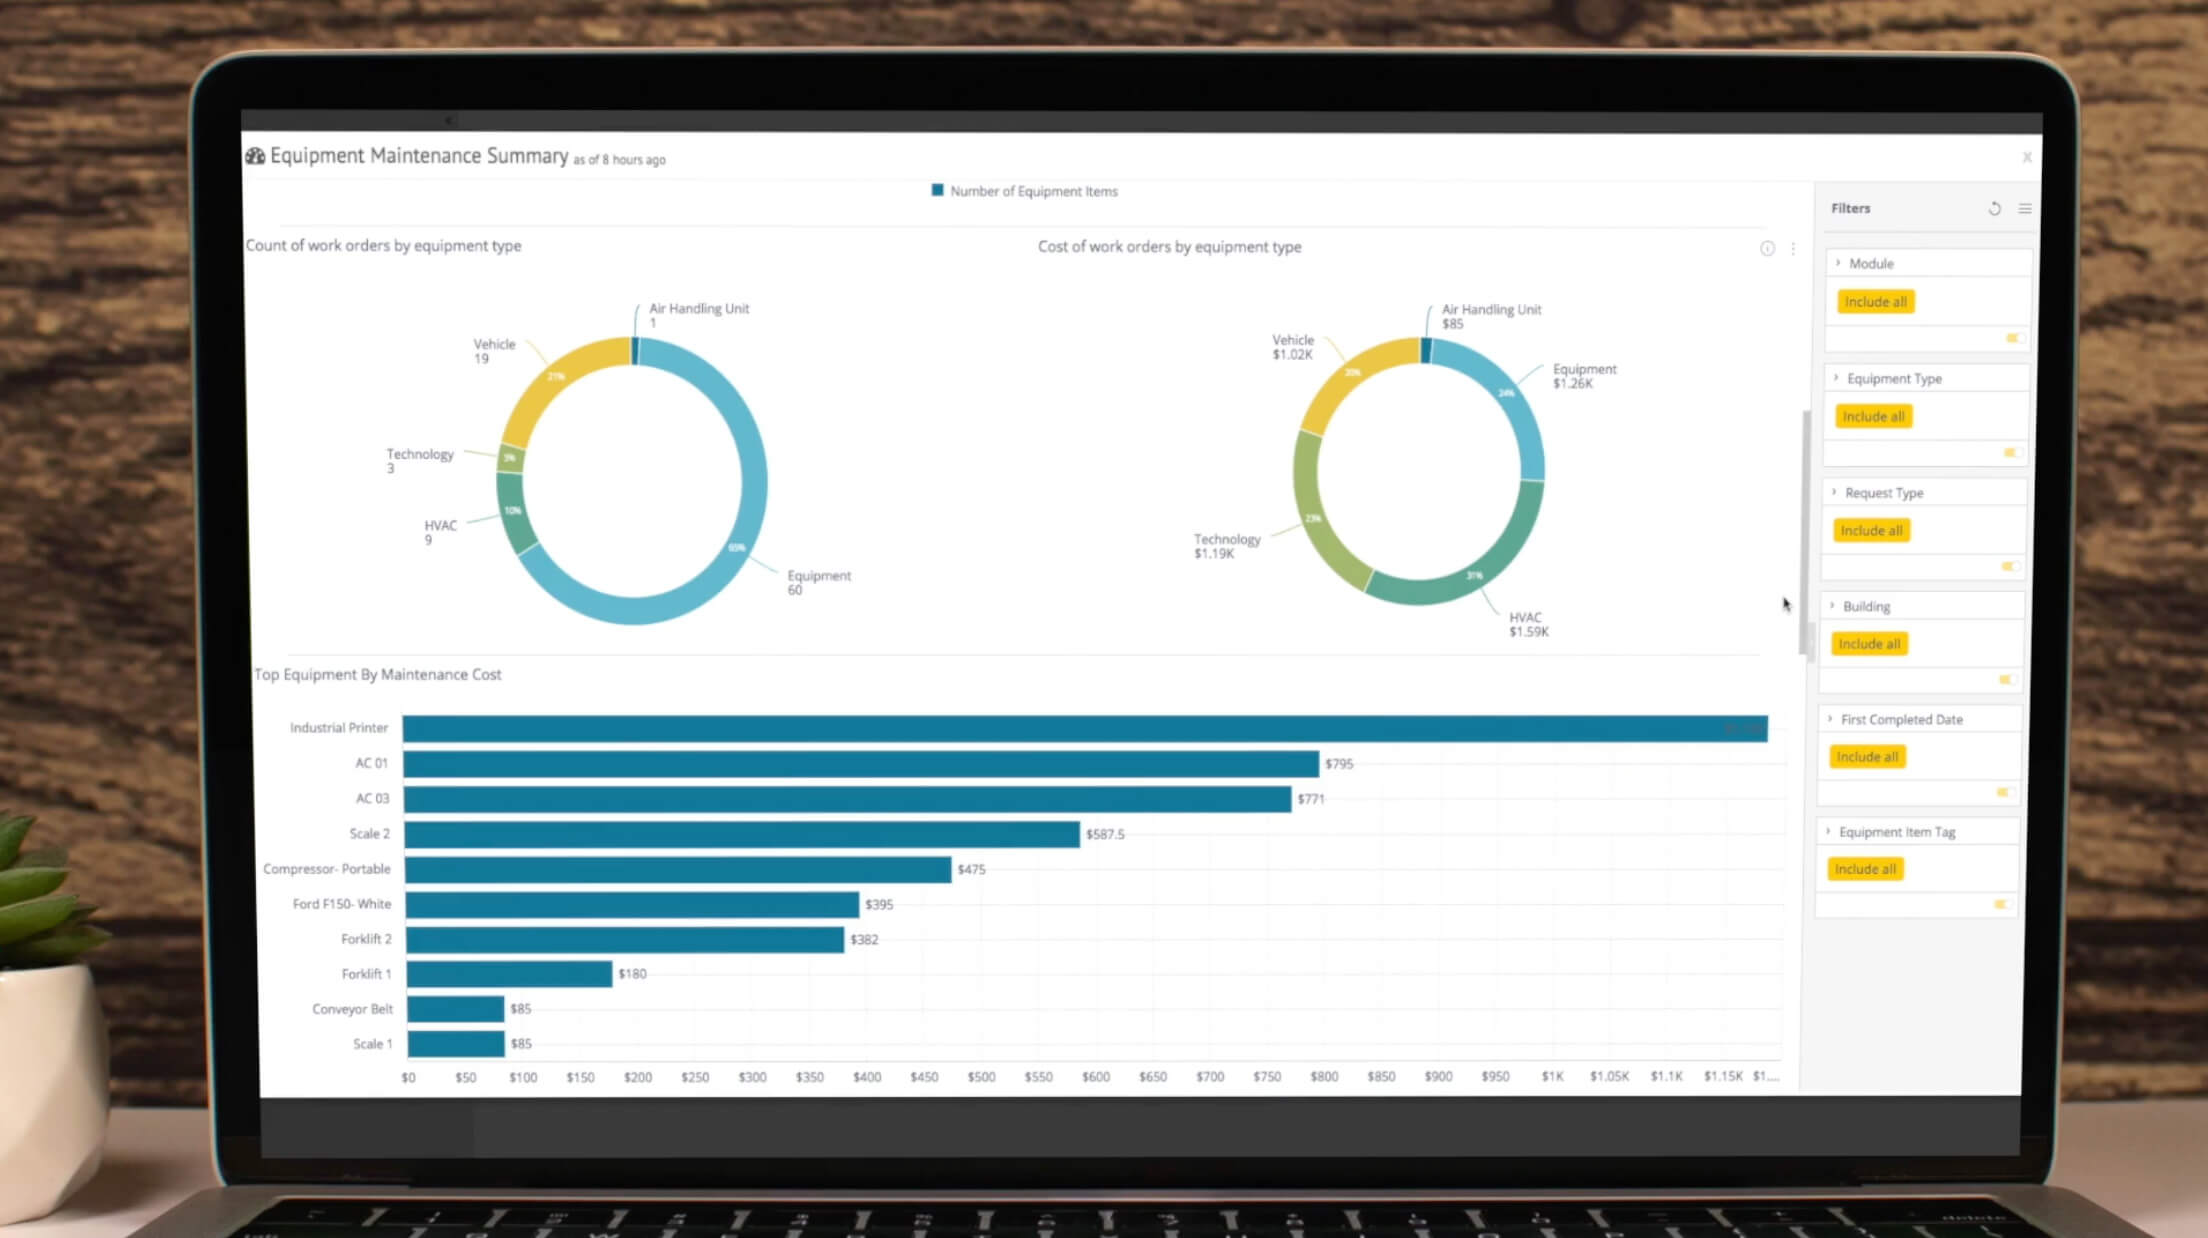
- Equipment maintenance summary
- Team & labor performance monitoring
- Capital planning & replacement insights
- Interactive dashboards and filtering tools
- Export for print and email distribution
Activate your operational data with insights and filters
See it for yourself
Gain actionable insights from your operational data
Need a specific report?
Need a specific report?
FMX has additional reporting capabilities beyond our standard and add-on dashboards. Don't see the exact report you're looking for? Reach out for more information on custom-built reports.
What are some examples of additional reports FMX can build?
- Utility Reports (View utility cost per square foot, utility cost, and usage graphs over a period of selected years or months, meter readings, billing data, and more)
- Maintenance KPI Reports (View total cost, cost per work order, cost per student, and cost by square foot along with a breakdown of where money is being spent)
- Grace Period Report (View PM completion status to ensure work is being completed within the accepted time period across all buildings)
- And more!
Benefits of reporting & analytics
Benefits of reporting & analytics
- Understand where to focus energy for improvements to your team and equipment.
- Compare how your team is performing compared to your KPIs.
- Make data-driven decisions about equipment replacement or IT devices.
- Improve your department’s capital forecasting.
- Calculate the return on investment that additional headcount would bring.
- Prepare for audits and budget planning.
- Ensure your organization is recouping or driving revenue by renting different spaces.
- Gain actionable insights to create operational efficiency across your organization.
Making the switch is easier than you think.
Allow us to handle the heavy lifting.
We work with your team to transfer existing data and build workflows to meet your needs.
Empower your team with an easy-to-use platform.
FMX is built with simplicity in mind, so anyone can use it and be successful.
We're here to help along the way.
Our team is here to train your organization, with lifetime support to answer your questions.
Frequently asked questions
What is the price of reporting?
When purchasing standard reporting, customers have access to 6 standard reports. Per request, the Event Building Usage, Invoices Summary, and Downtime Summary Report can be added on at no extra fee.
Add-on and custom dashboards are priced per report.
Can you export dashboards and reports?
Yes, dashboards can be exported as PDFs or Images. Static data reports can be exported as PDFs.
Can I set default filters on my reports?
Yes, users can save default filters within each dashboard so data can easily be filtered down.
Can reports be scheduled?
Only static reports can be scheduled and sent via email if users have the proper subscription permissions.
